It’s amazing to me that very few B2B marketers track marketing ROI, let alone any other marketing performance stats. According the Aberdeen Group, 78% of best practice companies track and measure their marketing results, compared to just 42% of companies that perform at industry average and 37% of companies defined as laggards.

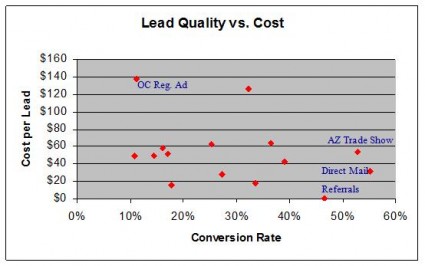
When I analyze B2B marketing results, I look at several stats. One piece of data that some of you know is cost per lead. Easy to calculate (total cost of marketing activity divided by the number of leads generated). But it’s not enough on its own. I look at cost per lead for one marketing activity, such as a trade show, along with marketing conversion (how many sales does a marketing activity produce?). This is important, because while maybe the cost per lead is high, if the conversions are high (or uber-high), I’m going to think differently about cost. I use Excel to plot both pieces of data so that we can compare performance across all activities.
In the example above, we showed one of our clients that their print ad running in a local newspaper (marketing cost per lead $138, sales conversion rate 11%) was not as effective as a trade show (marketing cost per lead $57, sales conversion rate over 50%), a direct mail piece (marketing cost per lead $32, sales conversion rate 56%), and (hello!) referrals which cost nothing but had a sales conversion rate of 46%.
What do you track to assess your marketing performance?


